May 2, 2023
“Sell in May and go away” is probably the most widely cited stock market cliché in history. So let’s take a look at this historical seasonal pattern to see if it is indeed true in this current market cycle.
What is sell in May?
“Sell in May and go away” is the seasonal stock market pattern in which stocks generally produce the best returns from November through April and the worst returns from May through October. The two figures below illustrate this pattern. Figure 1 below shows the historical average of returns by calendar month with data going back to 1950. It’s easy to see why an investor may want to sell prior to May. Even more so before September.
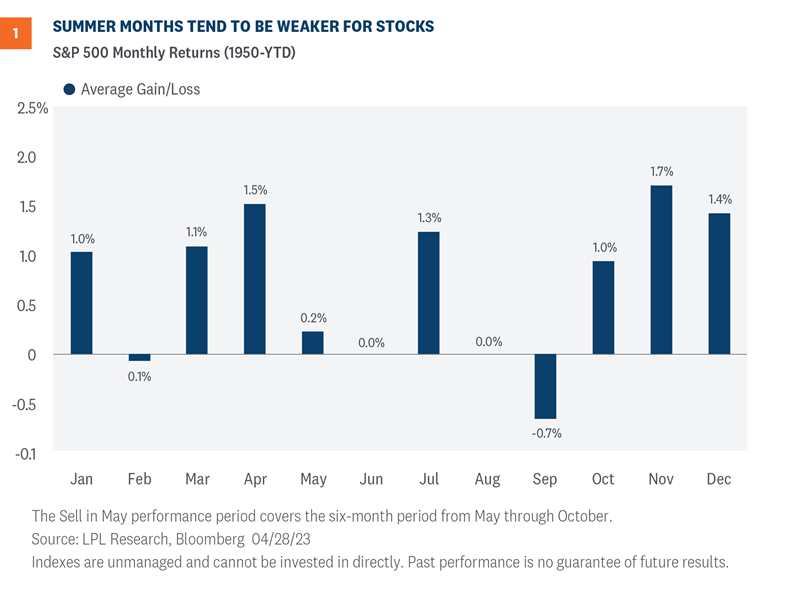
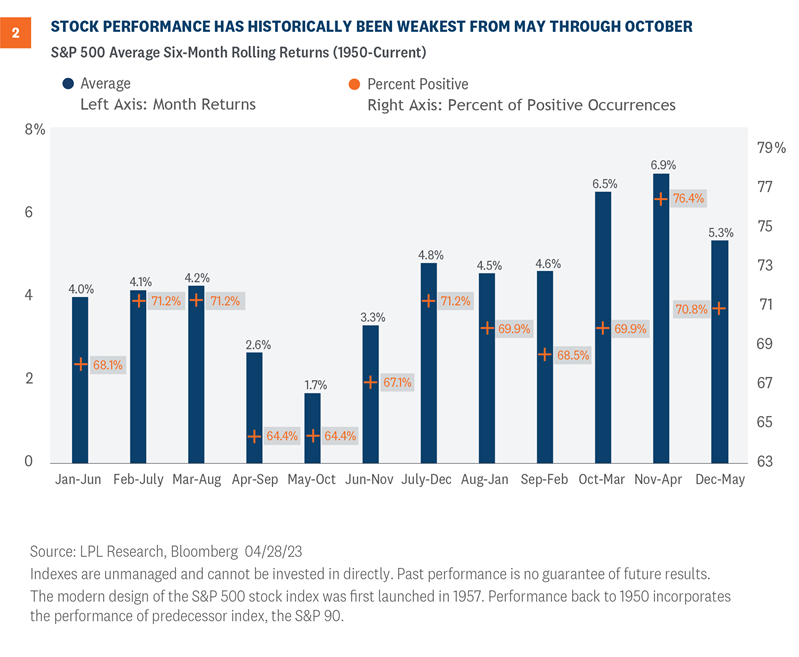
Figure 2 below illustrates a rolling six-month average return for each of the 12 rolling six-month periods by month (again, data going back to 1950). Here you can see the weakest six-month period for stocks historically, which on average, has been May through October (at 1.7%), while the best six-month period has come between November and April (at 6.9%).
Interestingly, in 2023 the S&P 500 was up 7.6% over the past six months (November through April), roughly in line with the historical average. This was in large part due to Technology which accounts for nearly 27% of the S&P 500 as of this writing.1
In recent years, buy in May has worked better
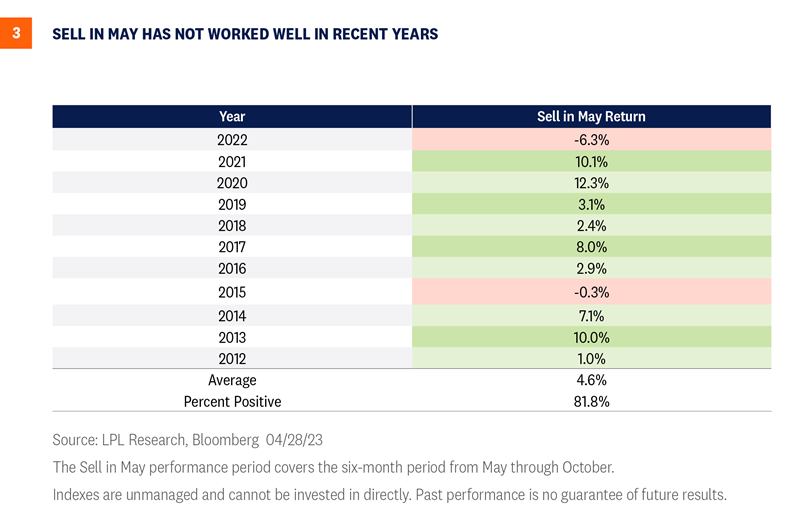
Considering my optimistic pessimist attitude, I would like to point out that the S&P 500 has closed higher during the month of May nine out of the past 10 years—so maybe we need to give thought to “Sell in June.” An argument can be made that selling in May didn’t fair to well for the average investor nine out of the past 11 years, as you can see below in Figure 3.
So what about this year?
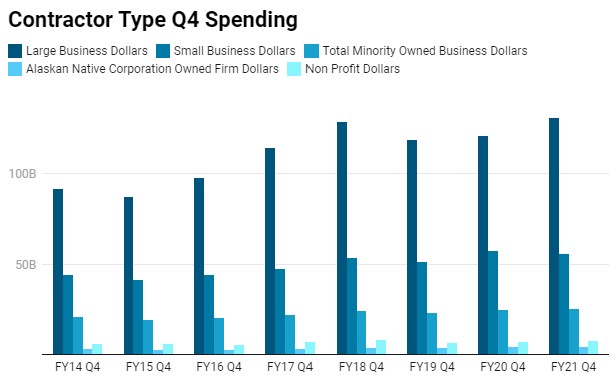
Assuming stocks generate another 4–5% upside between now and year end, the question is when do those gains come? Gains late in the year would make sense if we consider historical spending trends. According to a report monitoring fiscal spending, the fourth quarter seems to account for nearly 1/3 of annual activity going back to 2014.
Considering the above, I’m not so sure that selling in May is an opportunity. Thus far, 2023 has beat analyst expectations for just about EVERY firm on Wall Street. You can’t turn on the news without hearing about the war in Ukraine and it’s impact, the debt ceiling, the Fed and interest rates or unemployment and more job layoffs. And as you would expect, investors have followed suit like children following the Pied Piper as evidenced by the current “cash hoard.2” But – sorry to all English majors saying you can’t start a sentence using a preposition – thus far this year, the market has defied expectations.
This has led me to a new thought. What if we take a step back to be contrarians and viewed this as an opportunity to slowly buy back into the market? Obviously, you would want to keep a percentage of cash on the sidelines to: 1) gain more clarity on the path of the economy and 2) inflation, but are analyst over thinking this? As an Advisor that has seen the dotcom bubble burst, the housing bubble collapse in 2008 and the global shutdown from Covid-19, there is merit to employing a dollar-cost-average strategy starting in May. Why? Ask yourself, is it more favorable to buy high and sell low or buy low and sell high? Right now, market sentiment and traders’ positioning are pessimistic even with corporate earnings beating expectations. This is not to say that the future is bright, but the above suggest the consideration of a moderate buy back into the market.
Investment outlook
As stocks enter a seasonally weak period, investors may not want to stray too far from their benchmark exposures to equities. Stocks are getting more support from earnings than anticipated, but I wouldn’t go as far to say that earnings declines are over. While the May rate hike from the Fed may be its last of this cycle—we’ll learn more about that when we hear from Fed Chair Jerome Powell and company on Wednesday—clearly the inflation problem hasn’t yet been solved.
Bottom line, iPlan is still cautious, but we are considering a slight overweight allocation to equities – albeit through dollar cost averaging. In this capacity, we stick to our principle of measured risk for reward. What are your thoughts on this? Click on the links below to share your feedback. We would love to hear from you.
Important Information
This material is for general information only and is not intended to provide specific advice or recommendations for any individual. There is no assurance that the views or strategies discussed are suitable for all investors or will yield positive outcomes. Investing involves risks including possible loss of principal. Any economic forecasts set forth may not develop as predicted and are subject to change.
References to markets, asset classes, and sectors are generally regarding the corresponding market index. Indexes are unmanaged statistical composites and cannot be invested into directly. Index performance is not indicative of the performance of any investment and do not reflect fees, expenses, or sales charges. All performance referenced is historical and is no guarantee of future results.
Any company names noted herein are for educational purposes only and not an indication of trading intent or a solicitation of their products or services. All information is believed to be from reliable sources; however, iPlan makes no representation as to its completeness or accuracy.
Source #1: https://www.marketbeat.com/types-of-stock/sp-500-stocks/
Source #2: Investors put $538 billion into cash funds over eight weeks, Bank of America says | Reuters
From <https://www.washfinancial.com/market-commentary-050123/>